
Energy Savings from Indoor Air Quality Technology: What Building Owners Should Know
Particulate matter (PM) is a major contributor to air pollution worldwide, and the relationship between PM and adverse short- and long-term health effects is well documented.
One proven and critical strategy for improving indoor air quality (IAQ) includes mechanical air filters installed in a building’s heating, ventilating and air-conditioning (HVAC) system. Filters perform well capturing large, coarse particles.
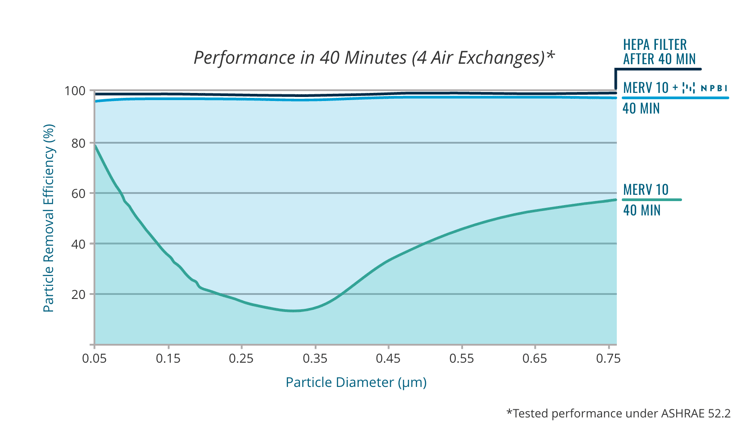
But almost all filters have a pronounced weak spot (1) when it comes to smaller particles that are less than 1.0 microns (µm) in diameter, including many viruses, bacteria and contaminants found in wildfire smoke.
This result is known as the MERV curve, where filter efficiency usually and counterintuitively drops before gradually recovering. Below, we provide a brief overview of how GPS needlepoint bipolar ionization (NPBI™) technology works to help reduce PM and improve IAQ.
We also share details and results from third-party testing(2) using a modified Association of Home Appliance Manufacturers (AHAM) AC-1 chamber with an American Society of Heating Refrigerating and Air-Conditioning Engineers (ASHRAE) 52.2 duct system for recirculation to demonstrate the benefits of enhancing conventional filtration with NPBI.
HOW NPBI REDUCES PM INDOORS
NPBI helps reduce indoor airborne particles of all sizes through a process called agglomeration.
Here’s how:
-
NPBI devices are installed in an HVAC system.
-
Fans move air through the HVAC system and over the NPBI devices, producing positive and negative ions that are delivered to the indoor space.
-
These ions combine with the particles in the indoor space, forming larger clusters that are more effectively captured by the HVAC system’s filter. Fewer particles mean cleaner indoor air.
WHAT THIRD-PARTY TESTING SHOWS ABOUT NPBI
A third-party, A2LA-accredited lab conducted multiple test runs with controls (NPBI on and off) to determine the reduction of airborne particles when NPBI is combined with mechanical filtration versus filtration alone. A GPS-FC48™-AC was used.
-
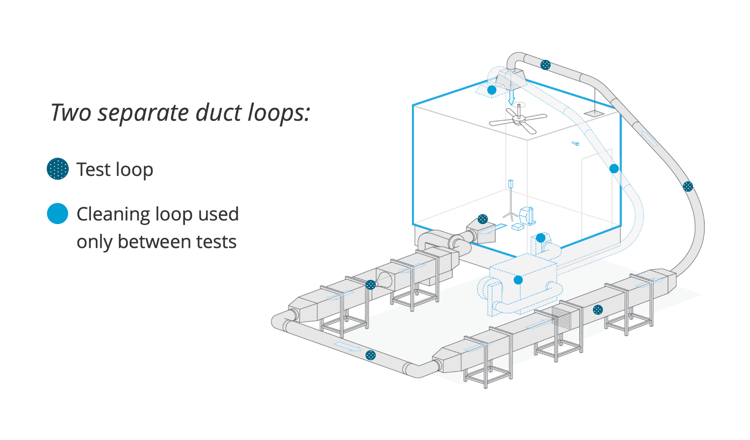
An AHAM standard-sized (10 feet × 10 feet × 10 feet) test chamber with air mixing was used. Test duct setup followed the ASHRAE 52.2 standard. Both mass and particle count by size were recorded.
-
Two separate duct loops were used, one for the tests and one to clean the chamber between tests.
-
Calibrated cigarettes were used as the particulate type to provide consistent starting points and particle sizes between 0.01 and 1.0 µm. This setup simulated field conditions such as wildfire smoke.
-
Testing was performed at six (6) air changes per hour (every 10 minutes), consistent with ASHRAE recommendations. Ion densities averaged between 8,000 and 9,000 positive and negative ions/cc, within the GPS real-world guidance(3) window of 2,000 to 20,000 ions/cc in HVAC applications.
RESULTS
Results demonstrate the additional reduction of particles in the air when NPBI is combined with mechanical filtration versus filtration alone.
For example, when NPBI is added to a test with MERV-10-rated filters, the percentage of particles across varying sizes is immediately reduced. Notably, after 40 minutes and four air changes in the chamber, MERV-10 filters plus NPBI achieve a removal efficiency that is comparable to HEPA-rated filters.(4)
Testing also shows that microscopic and submicroscopic particulate matter (<1.0 µm) is reduced 1.5 times faster with a filter plus NPBI compared to a filter alone, based on triplicate experiments after 40 minutes/four air changes per hour (and an average of 8,000 to 9,000 ions per cc).(5)
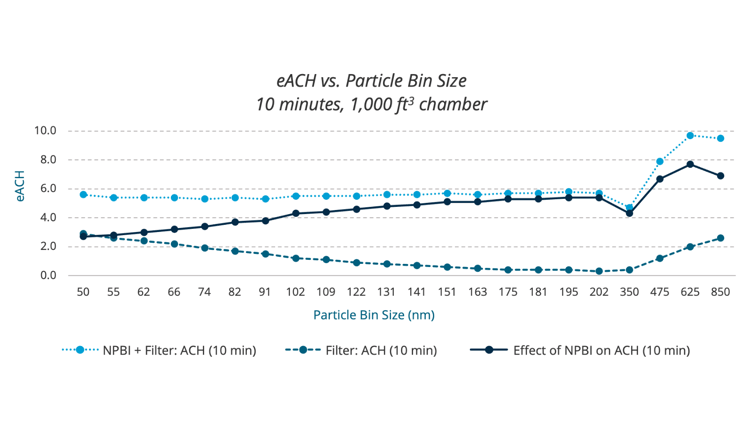
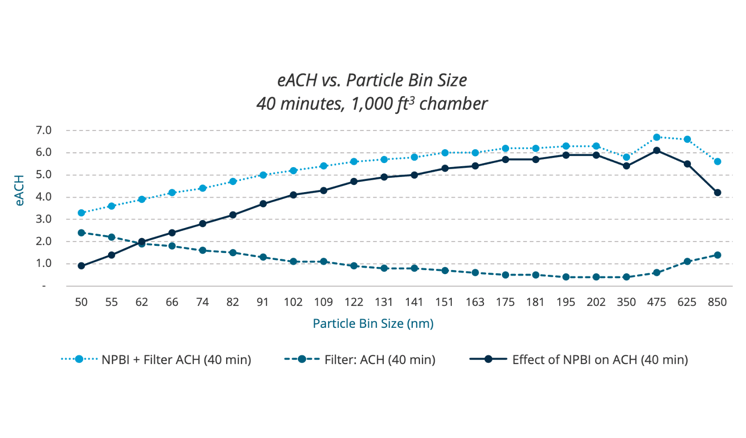
Additionally, when data from the tests are imported into a tool that helps translate results into equivalent air changes per hour (eACH) and equivalent clean air delivery rates (eCADR)(6), the outcome shows that NPBI delivers incremental benefits across the submicron particle range at different time intervals.
IMPACTS OF NBPI ON E-ACH FOR SMOKE
More specifically, as represented in the below graphs, third-party testing showed that NPBI delivered an average of 4.7 and 5.6 eACH incremental improvement after 10 minutes and 60 minutes, respectively, within the submicron particle size range grouped into bin sizes.
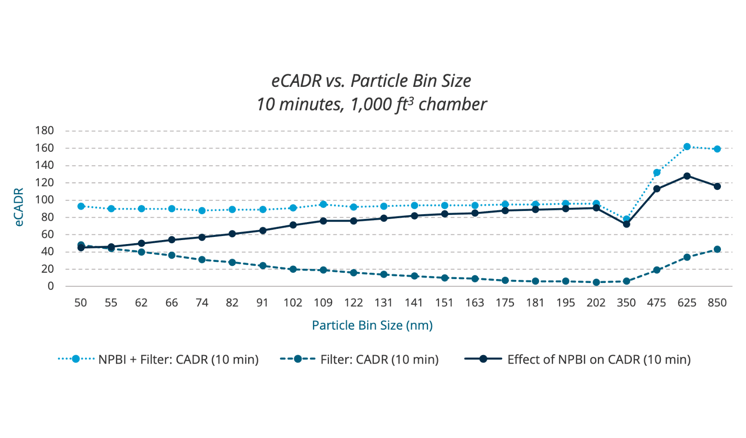
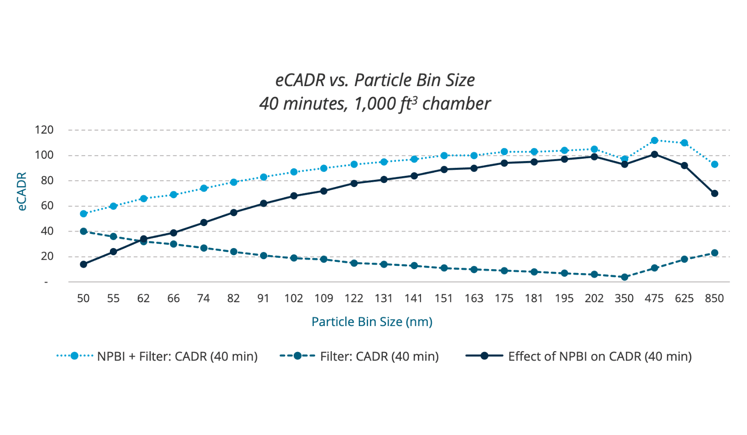
IMPACTS OF NBPI ON E-CADR FOR SMOKE
Additionally, as shown in the below graphs, third-party testing showed that NPBI delivered an average of 78 and 93 eCADR incremental improvement after 10 minutes and 60 minutes, respectively, within the submicron particle size range.
Applying NPBI as part of a multilayered approach to improving indoor air quality can deliver many practical benefits.
1 W. J. Kowalski and William Bahnfleth, “MERV Filter Models for Aerobiological Applications,” Air Media (Summer 2002).
2 This third-party testing was jointly executed, and paid for, by GPS.
3 GPS 2022 Sales Presentation, June 2022.
4 “What Is a HEPA Filter?” EPA, last updated April 26, 2022.
5 Removal rate (particle removal efficiency %) is calculated as a 10-minute running average of reduction in PM1.0 per minute over the target time period. PM1.0 is the mass concentration in μg/m3 of all particles with a diameter of less than 1.0 μm. Measurement was started after the first 15 minutes of testing to account for the high particle counts that result in an unusually high average reduction in the first 15 minutes; agglomeration and surface deposition were highest during this period. Ion density was calculated as an average of 30 minutes after reaching PM1.0 ≤ 35 μg/m3. This value was chosen as a proxy to ambient air based on EPA’s primary standard for supplemental health protection against short-term fine particle exposure, which is a 24-hour outdoor average (National Ambient Air Quality Standards [NAAQS] for PM, U.S. EPA). Product tested was the GPS-FC48-AC.
6 Clean air delivery rate (CADR) and air changes per hour (ACH) are widely used and generally understood metrics to evaluate the effectiveness of air-cleaning devices. CADR and ACH can be calculated by applying the Air Cleaner Efficacy Investigation Tool (ACE IT), a spreadsheet application designed to calculate and translate air cleaner performance data. ACE IT provides methods for the user to input test data and convert the information into an equivalent CADR and equivalent ACH for the size of the chamber used for tests. The tool is available as a free download from the Portland State Healthy Buildings website at www.pdx.edu/healthy-buildings/ace-it.
Disclaimer:
GPS Air™ makes every attempt to ensure that accepted industry test methods in controlled environments are utilized in the testing it commissions. The purpose of these tests is to isolate in these controlled conditions the impact on particulate reduction efficacy of a filter versus a filter used with our needlepoint bipolar ionization, NPBI™. Other tests run under similar circumstances achieved different results but within the margin of error of the results herein.
The test results relate only to the specific filter tested under the specific conditions tested. Actual results may vary depending on changes to a number of variables impacting filter performance, including but not limited to material type, static charge, dust loading, humidity, temperature, air velocity, particular size distributions, particulate type, and performance after additional hours of operation. Testing particulate reduction efficacy with filters and GPS NPBI™ technology is an evolving process, and additional testing will continue in the future.

